This report highlights Denver’s Coordinated Election on November 5th, 2019, particularly concerning Dr. Radhika Nath’s campaign for DPS Director in District 1. I demonstrate parts of an approach to engaging voters in a targeted manner, using highly curated data and social media. This report is a hybrid. I combine in-depth analysis and personal recommendations to provide strategic insight for political analysts, campaign managers, or to satisfy the curiosity of a Denverite.
Within this report, I examine the voter demographics in DPS District 1, expand on the DPS District 1 School Board Director race in November 2019, review opponent research, and dissect our campaign strategy. I analyze the outcomes of our campaigns tactics and examine their general efficacy. Accompanying these strategies, I review opponent research and list their contributions and major expenditures. Lastly, I analyze the digital efforts made by our campaign on Facebook and Instagram, and examine the results.
Methodology
Data Preparation
VoteBuilder permits basic filtering and data handling. In order to truly target based on the campaigns needs, I distilled the data in VoteBuilder and wrangled subsets of the data. Aggregating the voting population of DPS District 1 in Denver, I created subsets of the VoteBuilder master dataset containing 100,343 registered voters. I stratified these voters into three strati: Highly Likely Voters, Likely Voters, and Inactive Voters. I wrangled each strati by voting habits in local elections and characteristics like age and permanent residency. Targeting our resources wisely, I used the finances at my disposal on engaging Highly Likely Voters via Facebook, Instagram, and traditional canvassing.
The Voting Landscape: Denver Public School District 1
DPS District 1 Voters
DPS District 1 contains 76 precincts. Residing are approximately 100,343 registered voters. District 1 includes all of House District (HD) 6, HD 4, and a small portion of HD 7 and HD 10. At current estimates, unaffiliated voters outnumber all other political affiliations at 40,874 registered voters in DPS District 1. There are 40,262 registered democrats, 17,527 republicans, 339 greens, and 1341 libertarians.
The number of registered voters seem numerous; however, high voter registration does not mean that they are consistent voters. The voter landscape in Colorado shifted with the Voter Access and Modernized Elections Act of 2013[1]. Colorado is one of five states where elections are conducted entirely through mail-in ballots. The caveat of this convenience? Stricter inactive registration standards. A voter is inactive if their mail-in ballot forwards from a given address or if they fail to vote in the last four years.
Given a campaign with limited resources, and most importantly, time, political operations in Colorado that lack resources and outreach should not focus their efforts on inactive voters or selective voters (those who vote in presidential elections only). The voter demographics to pay attention to are 1. Highly Likely Voters, 2. Likely Voters, and 3. Highly Likely Late Voters.
Anticipated Voter Turnout
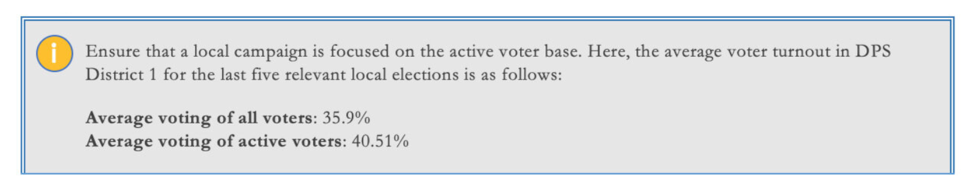
Anticipated voter turnout for the November 5th, 2019 Coordinated Election in Denver is 35.9 percent. In DPS District 1, total voter turnout in all local elections and all relevant elections in the last four years, the average turnout is 35,923 people. The active voter population in DPS District 1 is an estimated 87,191 people, and the number of voters who voted in five relevant local elections in the last four years accounted for 35,321 people or 40.51 percent of registered voters. In light of this, I created a benchmark that consists of the voter turnout from the following five Denver elections:
- June 4th, 2019 Municipal Run-Off
- May 7th, 2019 Municipal General
- November 7th, 2017 Coordinated Election
- November 3rd, 2015 Coordinated Election
- May 5th, 2015 Municipal General
Insight #1
Historical Voter Turnout
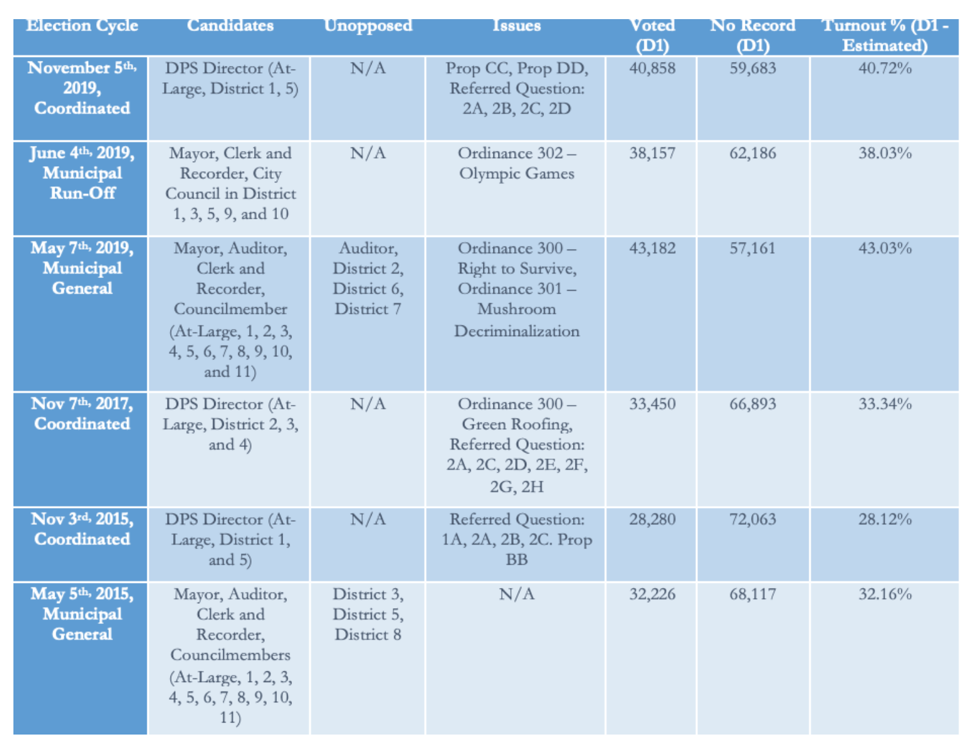
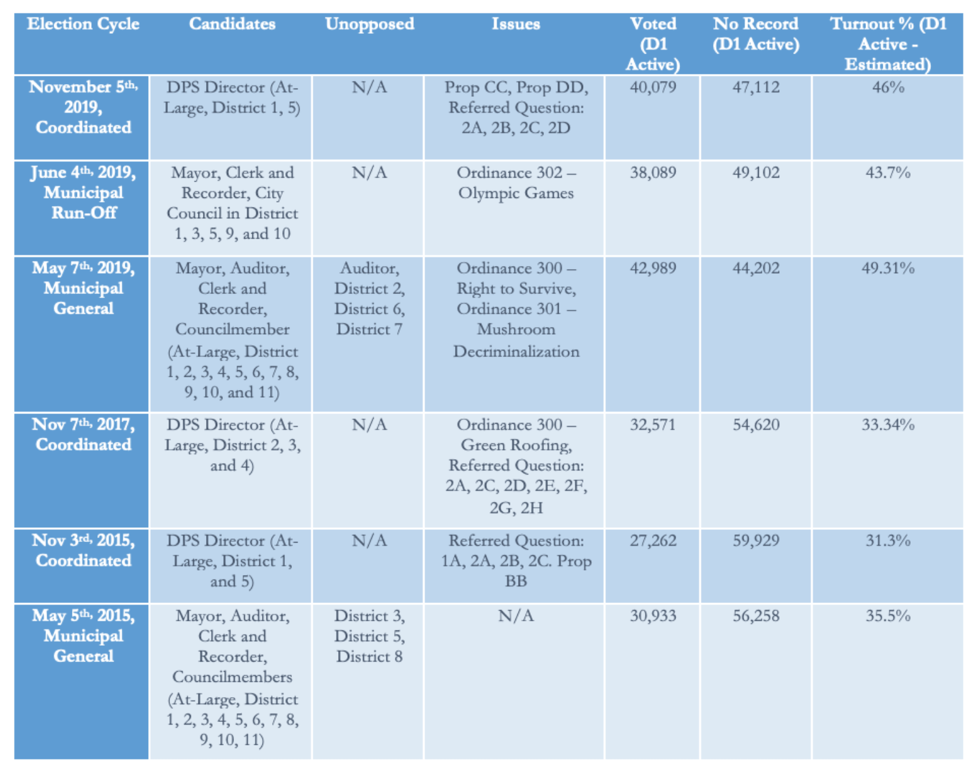
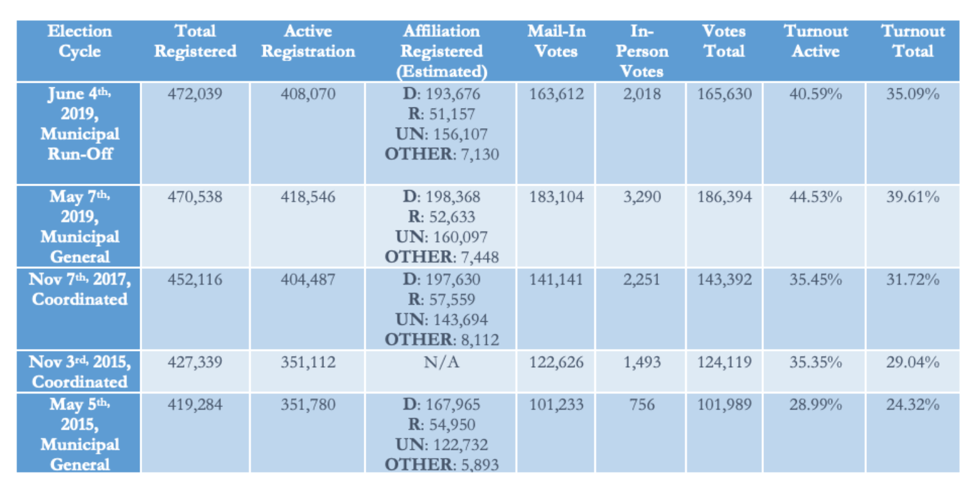
Given the date of this report, I included the latest data from the November 5th, 2019 Coordinated Election, where approximately 40.72 percent of all registered voters and 46 percent of all active voters participated in the election. The average of all voter turnout in all elections aside from the November 5th Coordinated election is lower than the actual turnout. The data suggest that voter turnout is higher than in previous years and appears to be a trend that may follow in the elections to come.
In comparison to the predicted turnout, the actual turnout for the November 5th Coordinated Election is approximately five points higher than the prediction. In the upcoming Coloradan elections, I anticipate voters will vote in higher numbers than previous local elections. I suspect that this increase is partly due to voters acclimating to Denver's voting system, and voters realizing the importance of participating in local elections.
Historical Voter Turnout in DPS District 1 – Total D1 Population[2]
Historical Voter Turnout in DPS District 1 – Active Registered D1 Population[3]
Historical Voter Turnout in Denver – Registration & Turnout[4]
Denver Coordinated Election Nov 5, 2019 Results
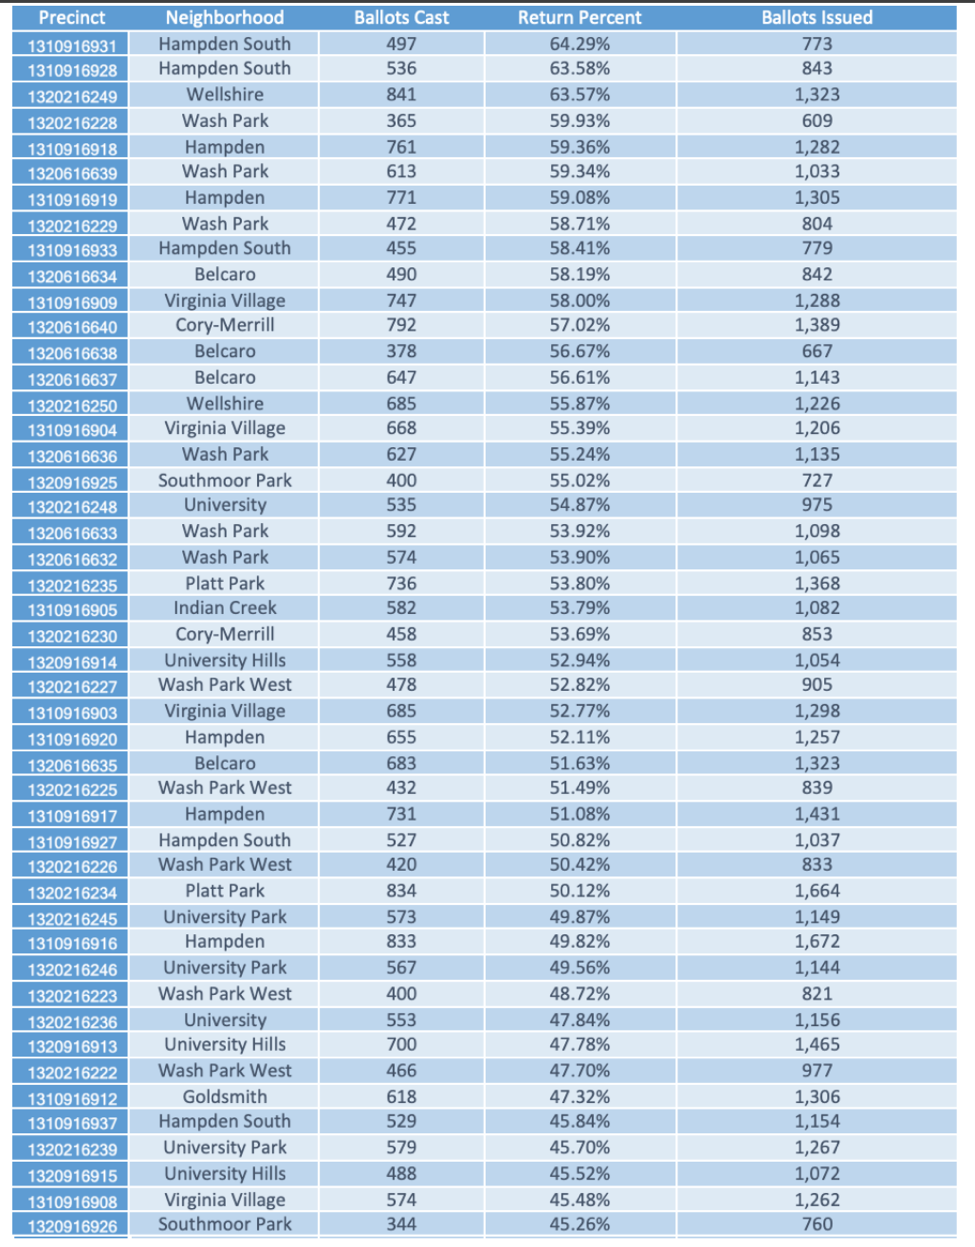
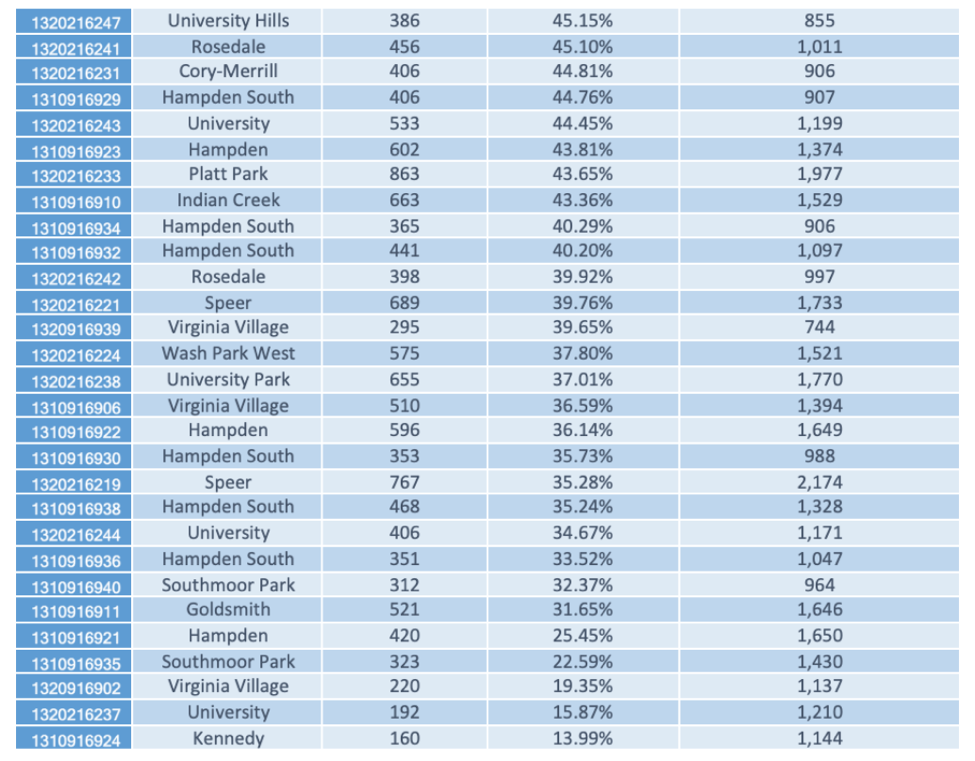
Actual Voter Turnout by Precinct
For the Denver Coordinated Election held on November 5th, 2019, the ballot return rate was notably higher in middle income and affluent areas like Wash Park, Belcaro, Wellshire, Platt Park, and Wash Park West. In Wash Park, the median household value is $846,900[5], while in Belcaro, it is $1,021,000[6]. The lowest rate of return was in the Kennedy neighborhood at 13.99 percent, while the highest was in Hampden South at 64.29 percent. The wealth and voter turnout connection is relatively consistent, but it is not always a reliable indicator of voter turnout. For example, in one part of Virginia Village, there was a 58 percent return rate, while in a different section of the neighborhood, there was a 19.35 percent return rate. There are many factors worth considering when analyzing voter behavior by precincts, such as median age, median household income, number of renters versus homeowners, and educational attainment.
District 1 – Denver Coordinated Election 2019 Results
Dr. Radhika Nath, a Southeast Denver candidate who ran for Denver Public Schools Director in District 1, failed to attain the required number of votes to win; however, given the general lack of funding in her campaign, her performance was impressive. She was outspent 20 to 1 by her opponents. Scott Baldermann self-funded his campaign to the tune of $350,000, and Diana Romero Campbell accepted large donations from pro-charter school millionaires and dark money Political Action Committees. Dr. Nath’s campaign began on June 13th and formally ended on November 5th, 2019. The lens in which this report is written is in hindsight of the campaign. As of November 12th, 2019, Denver released its unofficial election results, which Radhika received 7,468 votes (21.71 percent). Nath’s opponents, Diana Romero Campbell and Scott Baldermann received 10,684 (31.06 percent) and 16,242 (47.22 percent[7]) of the vote, respectively.
DPS District 1 – Demographics and Voting Behaviors
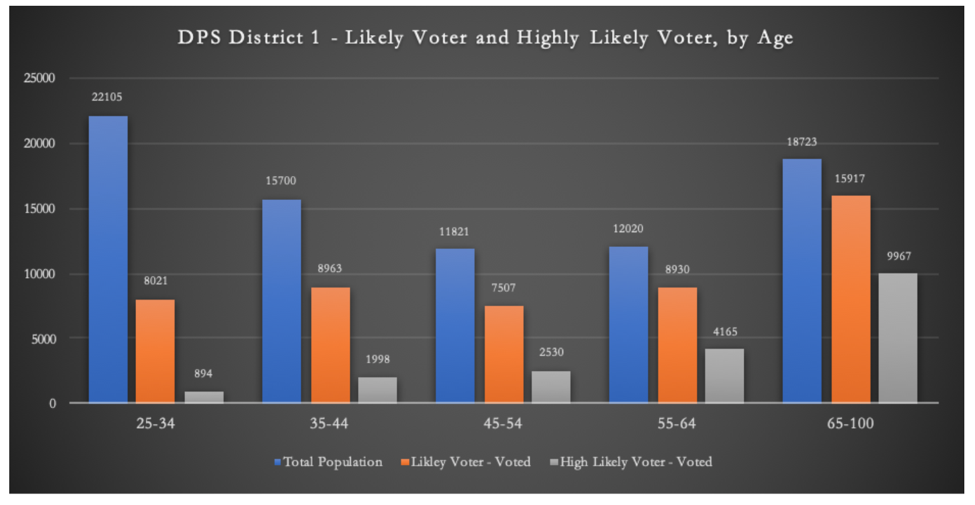
Highly Likely Voter Demographic – DPS District 1
The Highly Likely Voter (HLV) demographic is also known as the “super voter”. These are the voters that participate in every local election, they are politically active and have an intuitive understanding of local politics. HLVs tend to be wealthy, between the ages of 55 to 80, educated, home-owners, and with ample leisure time. To define the HLV demographic and to fine tune it in a voter database system like VoteBuilder, the major factors to consider are:
- Voting History: Participation in all relevant local election in the past two years or four years.
- Age: Segment by age in nine year increments.
- Suppression: Suppress by good mailing and voting address.
Highly Likely Voters – DPS District 1
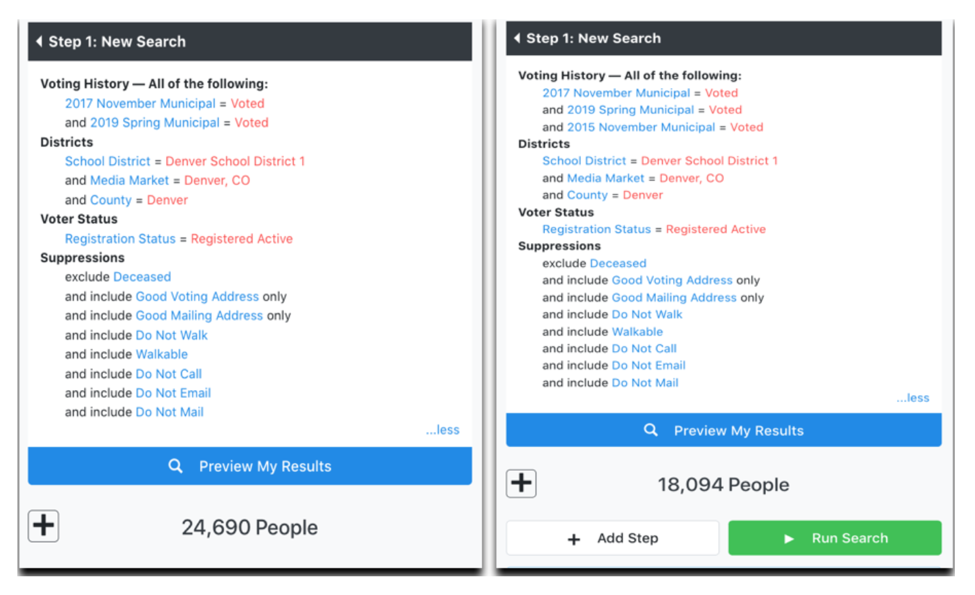
Image 1.1 is the VoteBuilder filters used to find Highly Likely Voters. VoteBuilder can only display 5,000 records at a time. To create datasets from VoteBuilder, first segment by age to capture a sample below 5,000, change your settings to display 999 records per page, and begin copying the data from VoteBuilder and pasting it into a spreadsheet application like Excel or Google Sheets. This is time consuming; however, the data gathered are absolutely critical in curating a list of voters to target. Ultimately, resources can be allocated both more effectively and efficiently with well-constructed and highly curated datasets.
Insight #2
Likely Voter Demographic – DPS District 1
Defining the likely voter demographic is a matter of two factors:
- Active voter registration.
- Participation in any local election in the past four years.
In Fall 2019, out of the 100,343 registered voters in DPS District 1, 87,196 voters have an active voter registration, while 13,153 registered voters currently have an inactive registration.
Most of the time, a campaign with limited resources should not focus their efforts on inactive voters. Only if a campaign has visited every door in the Highly Likely Voter and Likely Voter demographic at least three times, then inactive voters should be engaged.
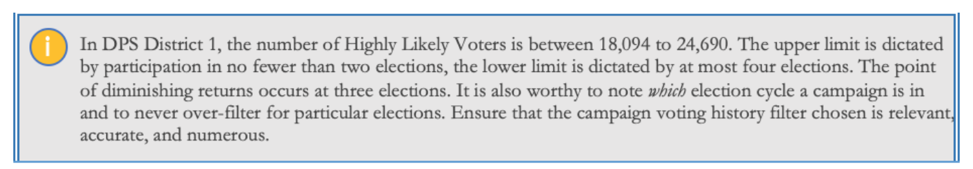
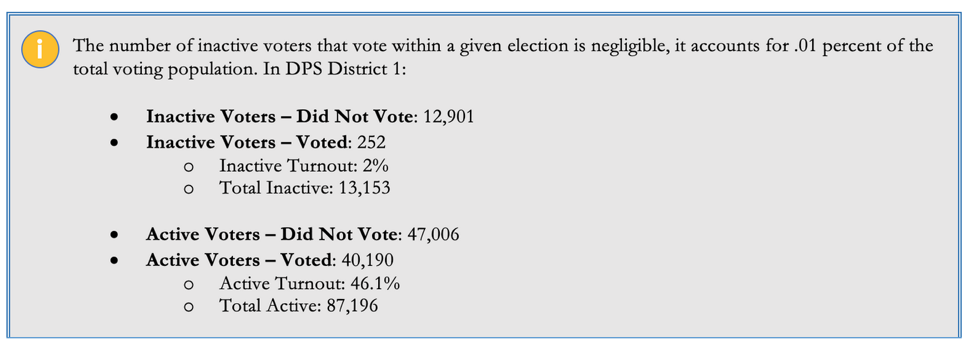
Consider the number of inactive voters that voted in the Denver 2019 Coordinated Election. Out of 13,153 inactive voters, only 252 submitted their mail-in ballot, that is about .01 percent of total votes. It is a different dynamic with active voters. Of the 87,196 active voters, over 40,000 individuals voted in the 2019 Denver Coordinated Election.
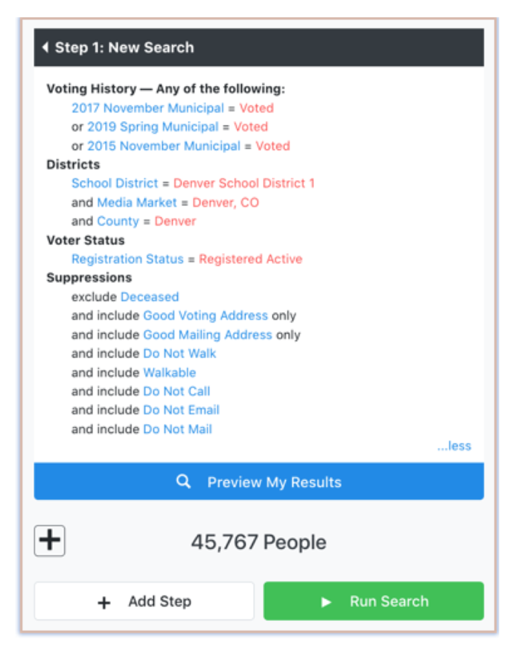
As seen in image 2.1, in VoteBuilder the filters applied include registered voters and any active voter that voted in any relevant local Denver election in the past four years. All things considered, the likely voter base in DPS District 1 is approximately 45,767 voters.
Insight #3
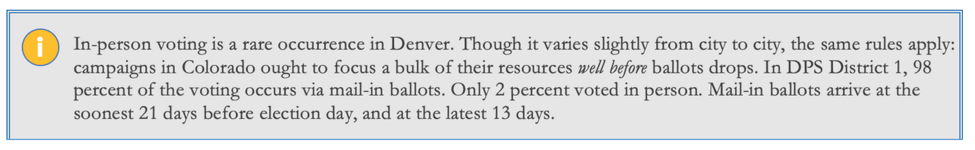
In-Person Voters – DPS District 1
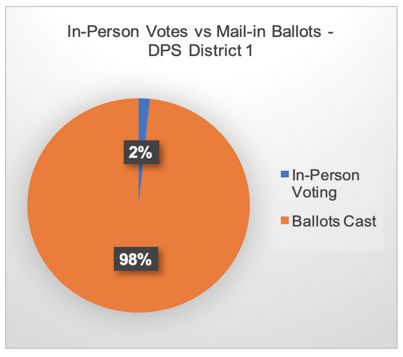
The number of voters that voted in the Denver 2019 Coordinated Election was 3,279 people in total. There are two voting centers located in DPS District 1, Denver Police Department District 3 (University) and Christ Community Church (Hampden South), in those facilities only 439 and 239 people voted in-person, respectively. Low in-person voter turn-out suggests that Denverites are phasing out in-person voting as their preferred method of casting a ballot. Mail-in ballots provide a convenience unmatched by in-person voting.
The reality of Denver voters voting habits is apparent: people are voting by ballot, and campaigns ought to take this into account when planning and operating a campaign. Campaigns ought to perform all their essential outreach tasks well before ballots are mailed to voters.
Insight #4
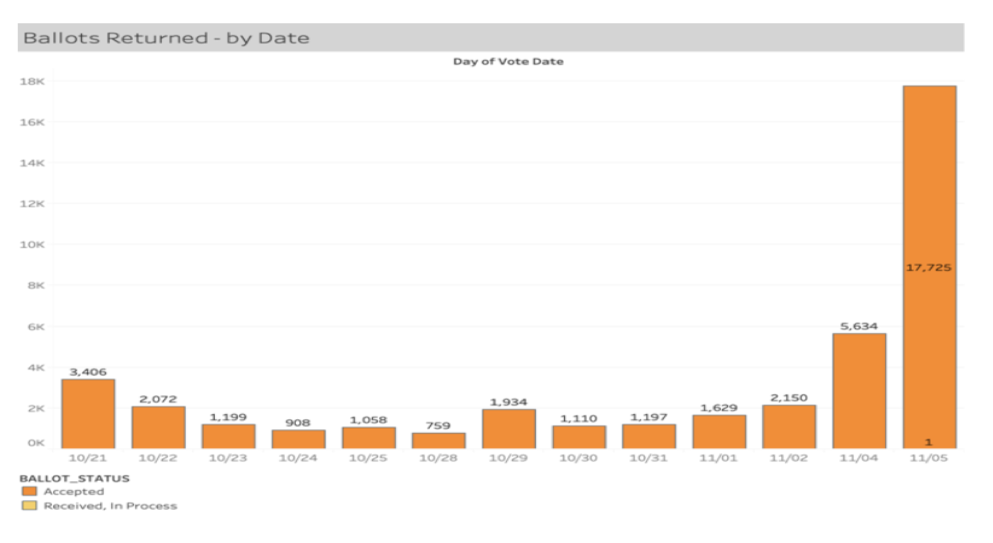
Ballot Returns by Date – DPS District 1
A trend that is consistent within DPS District 1 and Denver proper is late ballot drop-offs. Denver voters tend to procrastinate. This observation is superficial on its surface, however, there is an correlation between the big five personality traits and political affiliation. People who tend to score low on conscientiousness tend to have a liberal disposition, and therefore, generally less punctual, while individuals who tend to score higher on conscientiousness tend to have a conservative disposition, and are generally more punctual[8]. This may play a small role in why a majority of Denverites drop-off their ballots during the last three days of an election cycle, it is not the full picture.

Chart 3.1 ought to illustrate a clear reality for any campaign manager or field organizer operating in Colorado: all canvassing, mailing, and fundraising efforts need to occur before ballots are delivered to voters. By the time mail-in ballots arrive, a campaign must make at least three attempts to contact all Highly Likely Voters (HLV). This includes mailers, post cards, and a majority of physical outreach. Without a consistent and persistent canvassing and advertising strategy, physical outreach during the last three weeks of an election cycle will likely make little difference in swinging a campaign.
Insight #5
Competitive Research – Scott Baldermann
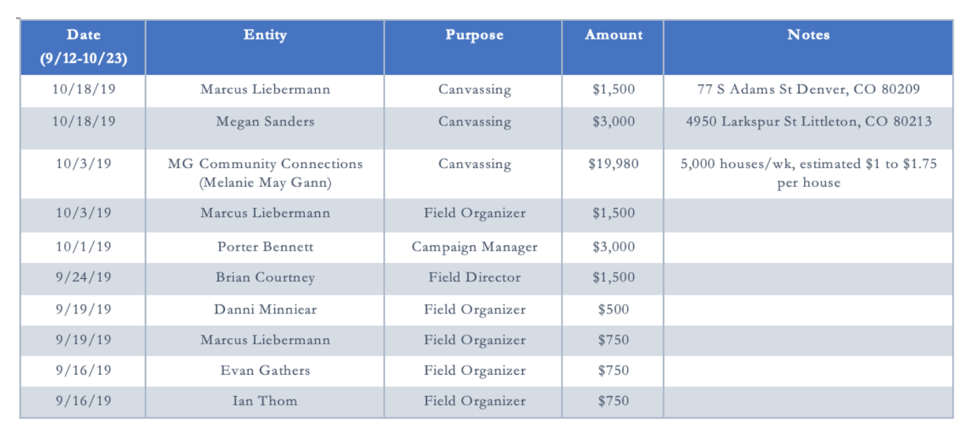
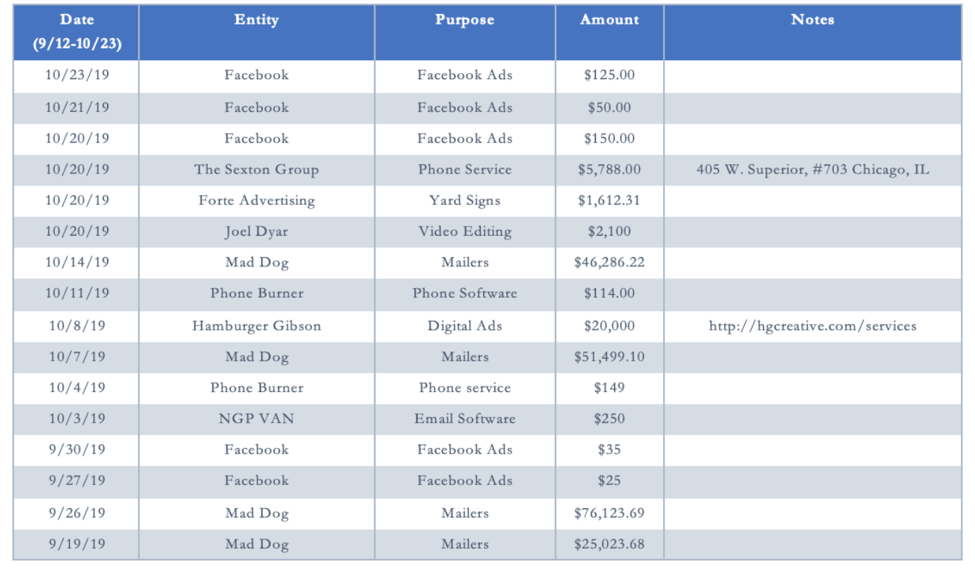
Scott Baldermann, ran as an anti-reform candidate and is multi-millionaire who made his fortune by selling his software company Attolist LLC to Newforma. Scott used his wealth in unprecedented proportions to fund a vast majority of his campaign, funding it to the tune of $334,510[9]. His average contribution is $1,018.85, deriving from 350 individual donors.
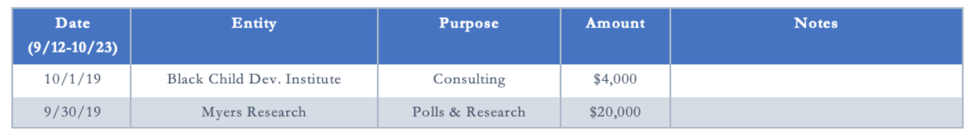
His campaign strategy and ground strategy focused heavily on canvassing, mailers, and phone banking. Scott hired a number of individuals to manage his canvassing activities. In addition, he hired MG Community Connections for $19,980, which enabled him to reach 5,000 doors a week, for an estimated $1 to $1.75 a door. Scott gained a particular informational advantage by hiring a polling service for $20,000. His insight into the feelings and attitudes of the residents of DPS District 1 gave him an asymmetric advantage in the realm of actionable data. Overall, Scott spent approximately $229,331 in advertising related activities, making this the bulk of his campaign expenditure.
Scott Baldermann - Campaign Expenditures
Competitive Research – Diana Romero Campbell
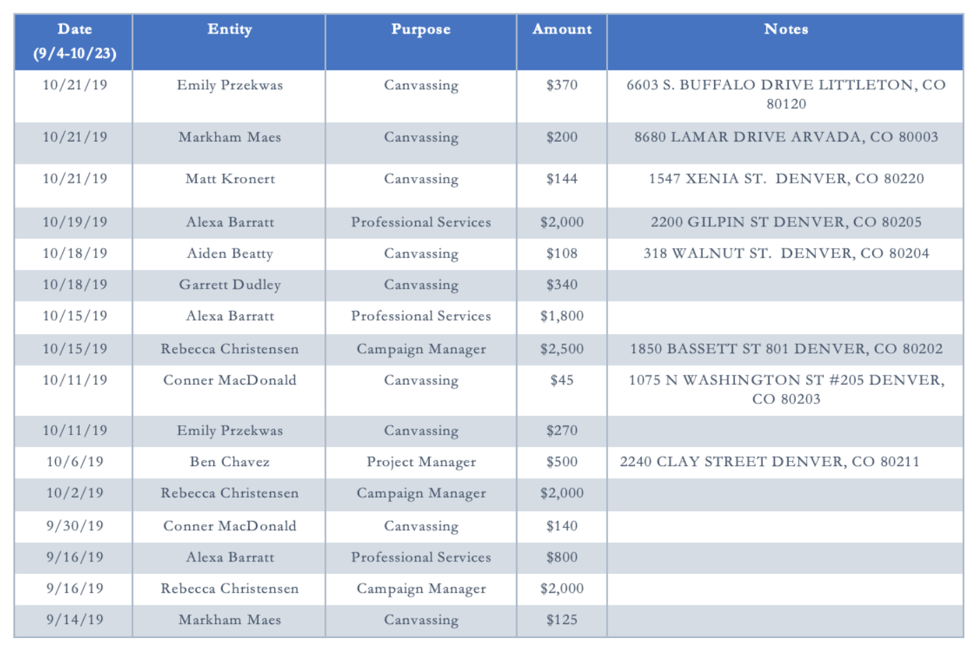
Diana Romero Campbell is the president of a local non-profit organization and worked in multiple non-profits like Colorado Children’s Campaign, Mile High United Way, and currently Scholars Unlimited. She has spent a majority of her career in non-profits, dedicated to improving the lives of children. She ran as a reform candidate, promoting charter schools and the interests of pro-charter organizations.
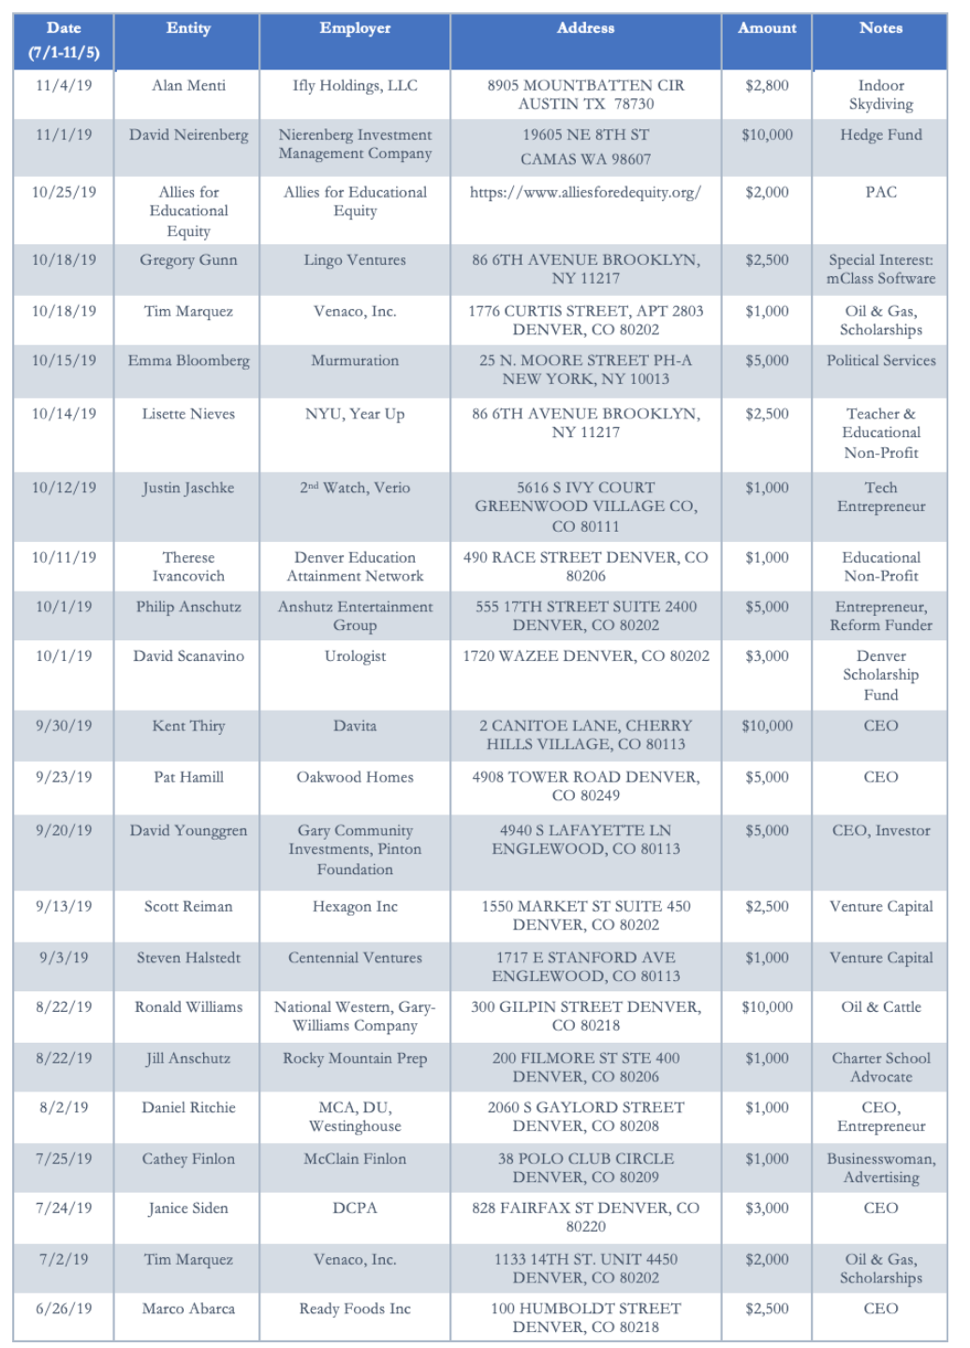
Diana’s major source of funding was from big dollar contributors and known charter school investors. She received over $128,739[10]in direct campaign expenditure support from special interests and independent expenditure committees (IECS), and approximately $144,597 in indirect support. Organizations like Students for Education Reform (SFER) and Stand for Children, or Better Schools for a Stronger Colorado (Stand for Children IEC). Furthermore, Diana’s campaign accepted $79,800 in contributions over $1,000. Notable contributors include Emma Bloomberg, Bruce Benson, Phil Anschutz, Jill Anschutz, and Kent Thiry.
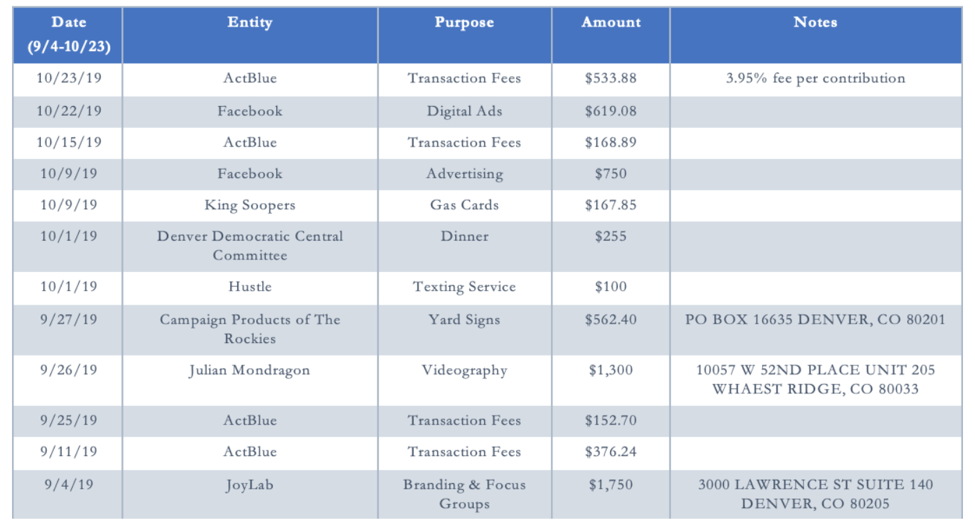
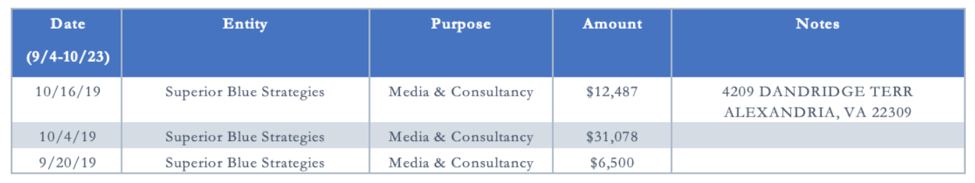
Diana’s strategy relied heavily on hired canvassers and the canvassing efforts bought by her IEC donors. Generally, this was a more effective strategy than originally anticipated. Overall, her budget was a reported $105,381.31[11], with the IEC expenditures, she had approximately $234,120.31. By the end of her campaign, she had budget of $19,560.
Diana Romero Campbell – Campaign Expenditures & Contributions
Radhika Nath – Canvassing Results
During the length of Dr. Nath’s campaign, 221 people volunteered or expressed interest in volunteering in some capacity. The number of individuals that canvassed for Dr. Nath is 42. In total, they knocked on an estimated 21,356 doors[12], with 3,404 successful contacts. Dr. Nath’s campaign had a contact rate of 16 percent. This contact rate could have been moderately improved by increasing canvassing efforts during the weekends and implementing an after work canvassing shift during the weekdays, between 5pm and 6:30pm. Nevertheless, Nath’s campaign performed slightly below average in terms of successful contacts, yet performed remarkably well in terms of polling.
Insight #6
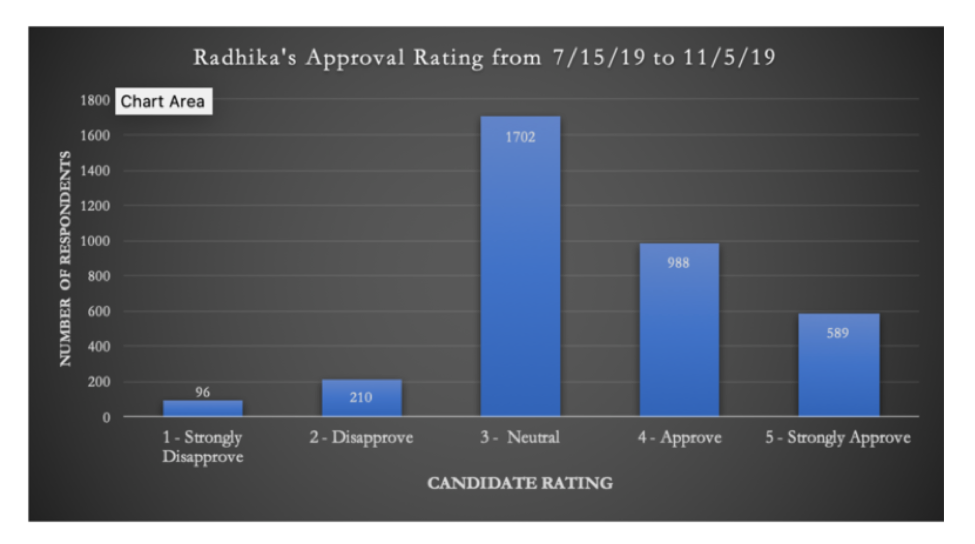
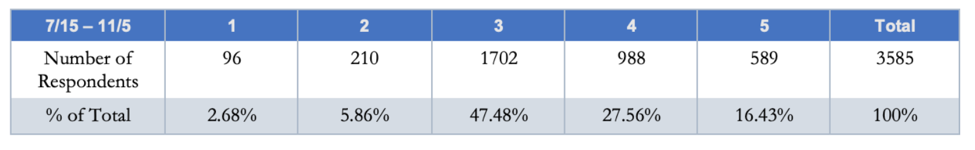
Radhika Nath – Polling Results
The survey conducted during Dr. Nath’s campaign is a measure of relative approval taken by the canvassers, and interpreted from the point of contact. It is a one through five rating system, one being that the contact strongly disapproves of Radhika as a candidate, and a five being that the contact strongly approves of Radhika. The canvassers either asks the contact directly or the canvasser self-reports the contacts impression.
Dr. Nath polled considerably well, with 92 percent of voters having at least a neutral impression of her. Voters with positive impressions of Radhika, either approving or strongly approving of her as a candidate, was considerably high at 44 percent. Only 8 percent of respondents disapproved or strongly disapproved of Radhika.
Insight #7
Radhika Nath – Digital Ad Result
Launch Video – Overview
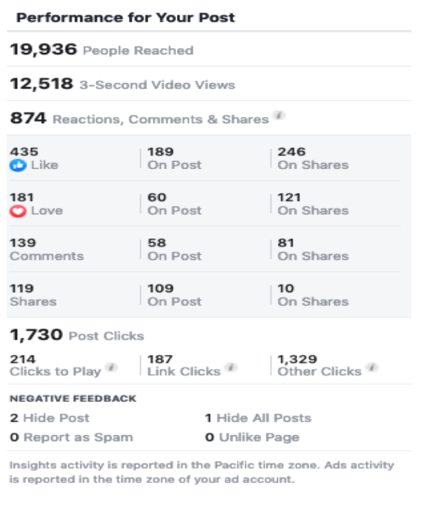
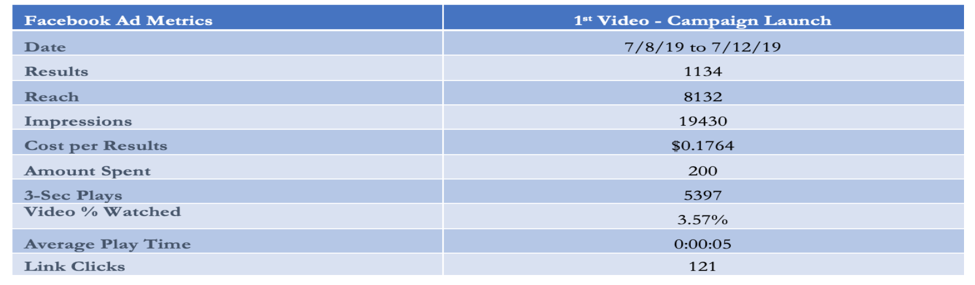
The campaign launch video was the first video of the Nath campaign. It is 2 minutes and 30 seconds in length and was completed at no cost. The launch video was an excellent way to introduce the candidate and show her personality, values, and most importantly, how Dr. Nath intended on fixing Denver Public Schools.
In light of the launch video post’s performance, it reached 19,936 people, with 1,730 post clicks, and 874 reactions, comments, and shares. For any advertising campaign, the most ideal outcome on Facebook is organic reach. The launch video garnered 119 shares and 4.9 thousand minutes watch. What propelled the video was the organic reach, which accounted for 67 percent of the video’s viewership. Paid reach accounted for 33 percent of the video’s viewership. The launch video’s audience was not targeted and its advertising bounds was within Colorado.
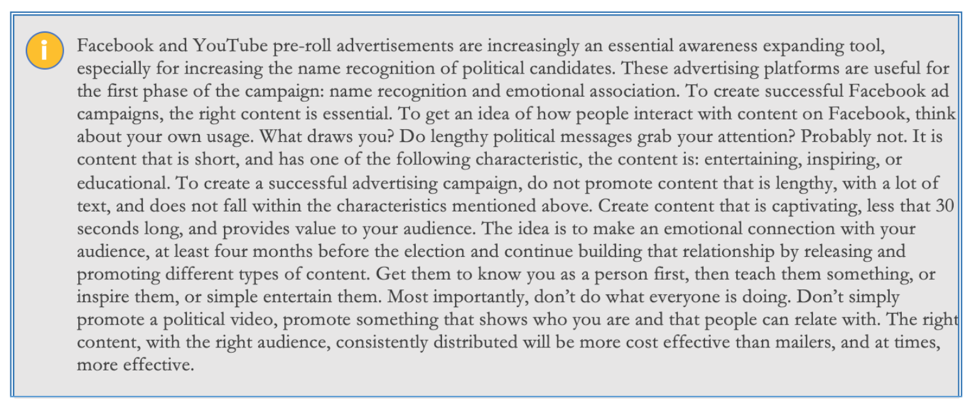
The cost of expanding the reach of the video on Facebook cost the campaign $200. It cost $.18 per view, and the average play time was 5 seconds. On average people who viewed the video via paid reach did not watch past the 5 second mark. This is to be expected when launching content on Facebook that is lengthy.
Insight #8
Launch Video – Platform Placement
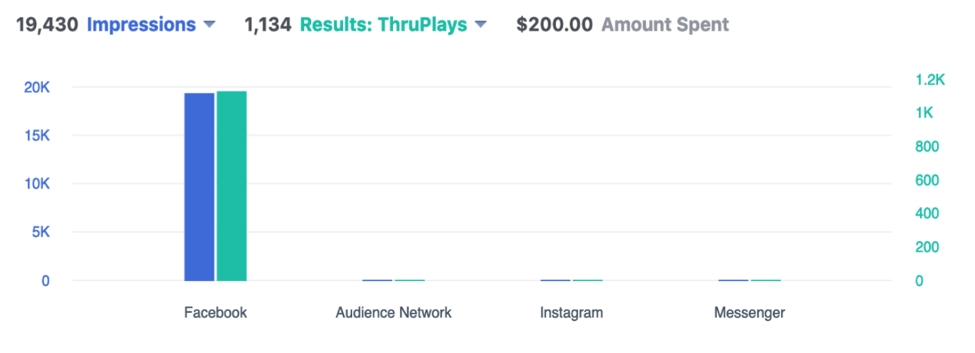
The video placement shows which platform a piece of content was hosted on. For the launch video, it was placed predominately on Facebook. Considering that it was a long form video, this medium is ideal, since the video watching feature on Facebook is far more developed than Instagram, and overall, an audience is more likely to interact with this kind of content on Facebook than other platforms.
The graph below illuminates how many impressions (people observing the content on their screen) were made on the Facebook platform from the paid campaign. Overall, 19,430 impressions and 1,134 thruplays (watching a video for 3 seconds or more) occurred.
Launch Video – ThruPlay
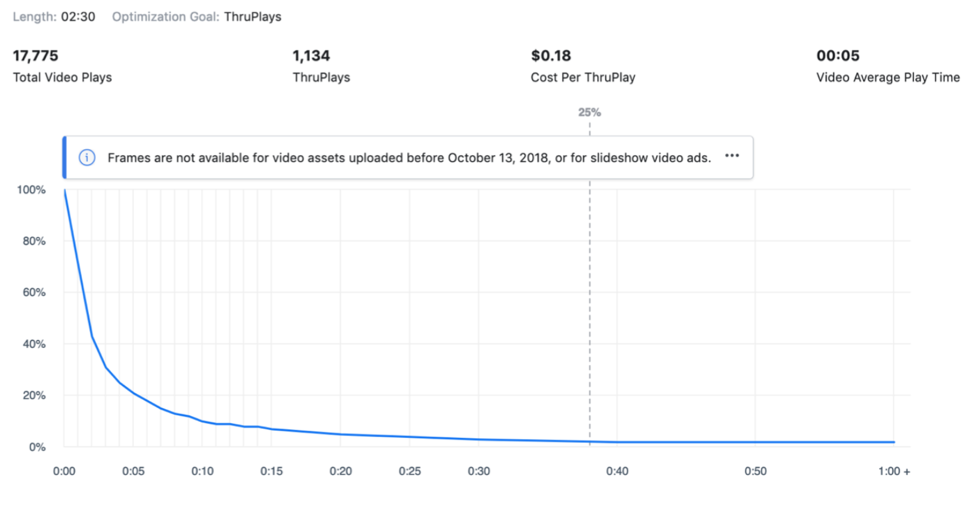
The launch video was watched on average 5 seconds, this is not ideal since the video is 2 minutes and 30 seconds in length; however, 25 percent of viewers watched till about the 38 second mark. This is more promising, and demonstrates something that captivated a percentage of viewers. The graph below follows a typical exponential probability density function, where it spikes at the beginning and exponentially decays over time.
Launch Video – Demographics
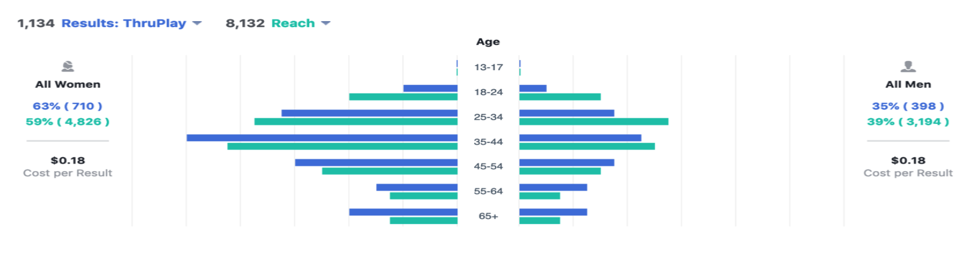
Since the launch video was not targeted, it was broadly broadcasted to all audiences from the ages of 18 to 65+ living in Colorado. Considering that Highly Likely Voters in DPS District 1 are 65 and older, this video could have benefited from targeted an older demographic. Though this was a missed opportunity, the campaign received an interesting insight: women from ages 35-44 responded particularly well to Radhika and her message.
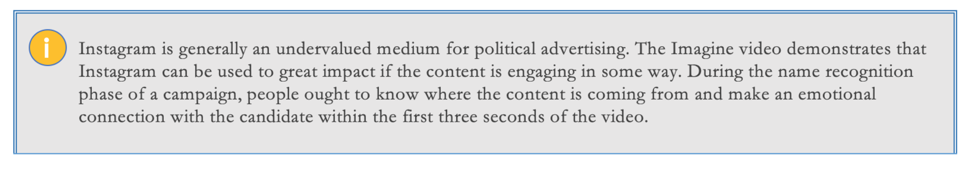
Imagine Video – Overview
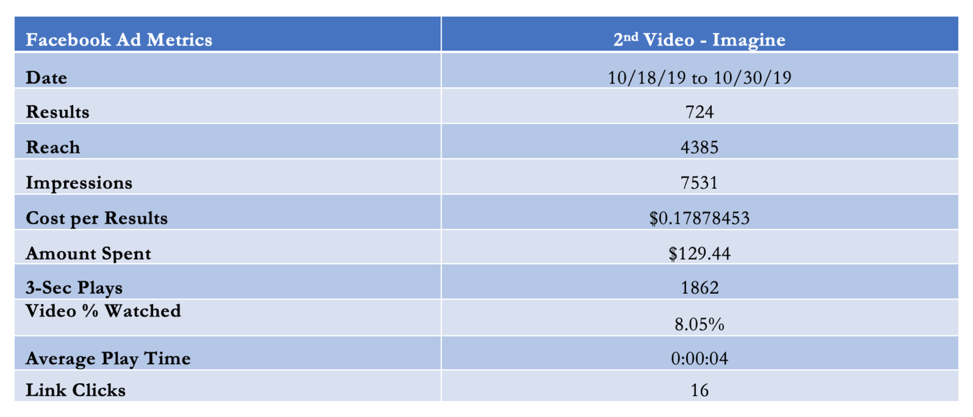
The Imagine video was the last paid video campaign, also completed at no charge. The video campaign began on 10/18 and ended on 10/30. Overall, the advertising campaign was a success, though, there was an obstacle: the video was demoted due to the amount of text in the original post. How much the text impacted the video is unknown. Accounting for the demotion, the video performed relatively well. At a cost of $.18 per thruplay, and a total budget of $129.44, the video reach was 4,385, with 7,531 impressions. Overall 1,862 people watched at least 3 seconds of the video, with an average watch time of 4 seconds.
Overall, the post of the Imagine video reach 17,119 people, 5,066 people watched at least 3 seconds of the video, and there was 377 reactions, comments, and shares. People who watched 15 seconds of the video tended to watch the full video. Of the 15-second watch group, 66 percent watched the entirety of the video.
Imagine Video – Average Play Time
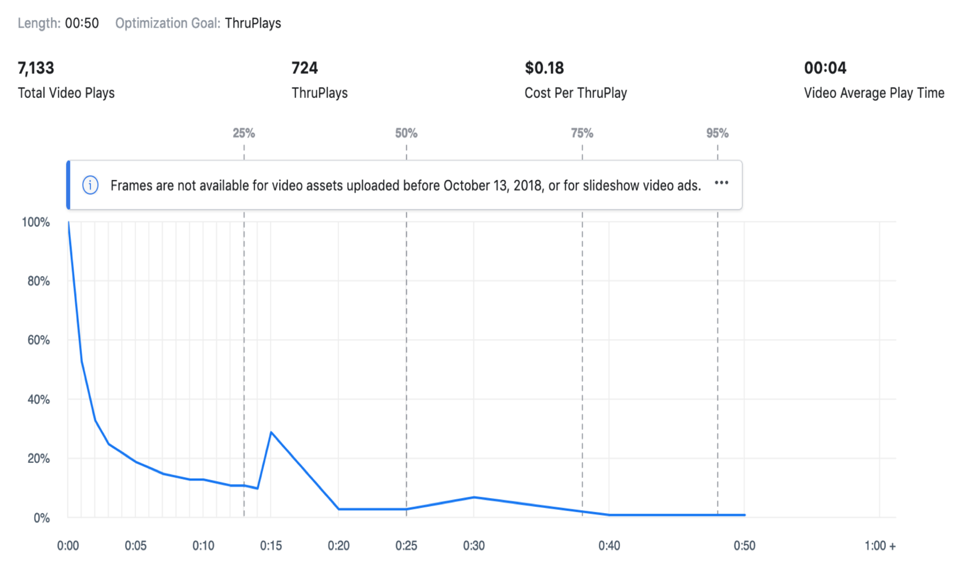
As evident in chart 8.1, the distribution follows an unusual exponential probability density function, where a majority of viewers lose interest before 25 percent of the video is played. Though, an interesting spike occurs at the 15 second mark, indicating that about 30 percent of the thruplay occurred at that part of the video. The Imagine video attracted and retained more attention than the launch video. This could be due to the quality of the content, its inspirational message and music, its placement, and its length.
Imagine Video – Video Placement
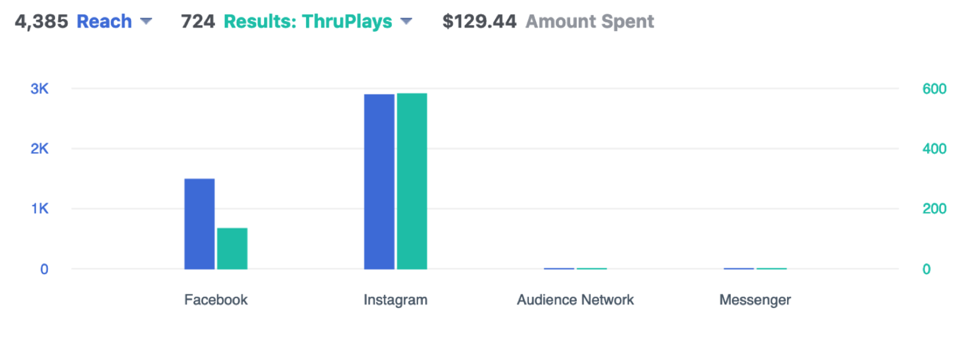
The Imagine video was placed on both Facebook and Instagram, with a higher amount of engagement and thruplay on Instagram, though, on Facebook, there was a higher proportion of reach to thruplay. It demonstrated that for this type of content, at 50 seconds, the video performed significantly better on Instagram than Facebook. With a nearly 1:1 ratio of reach to thruplay, Instagram engaged more people than Facebook. The reason why there was more engagement on Instagram than Facebook was due to the optimization goal, it is easier to get more thruplay on Instagram than it is on Facebook.
Insight #9
Imagine Video – Demographics
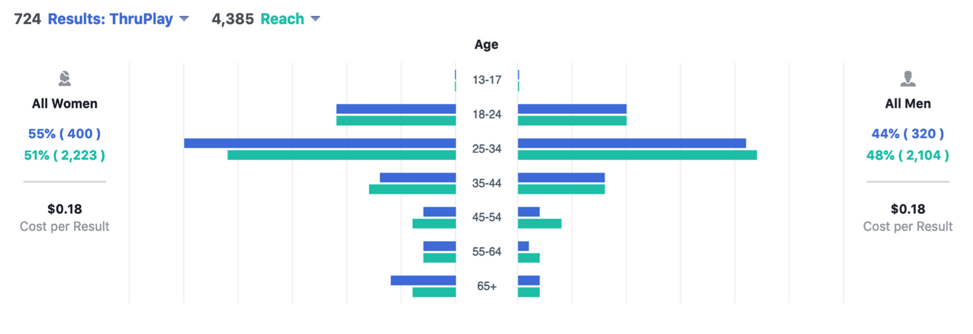
The Imagine video was targeted toward a defined demographic, and its placement was both on Instagram and Facebook. Apparently, the defined demographic was not followed as it was on Facebook. The highest levels of engagement were from women 25-34. Considering that the most engagement came from Instagram; the platform typically has a younger demographic.
Imagine Video – Defined Audience
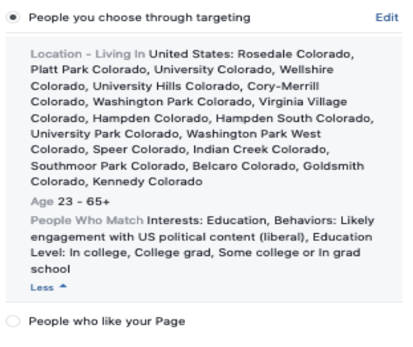
A targeted audience is crucial for any ad campaign, and the Imagine video was targeted to all the neighborhoods in South Denver that are within DPS District 1. Additionally, it was targeted toward people with educational interests, and certain behaviors, such as likeliness to engage with liberal content, and educational attainment, like being in college, a college graduate, or in graduate school.
Insight #10
Sources
[1] Data source: https://www.pewtrusts.org/en/research-and-analysis/issue-briefs/2016/03/colorado-voting-reforms-early-results
[2] As of 2019, there are approximately 100,343 voters in DPS District 1 with active and inactive registration. 100,343 is the base number for the averages and do not account for the fluctuations of voter registrations in DPS District 1. The data was gathered from the following sources: https://www.denvergov.org/electionresults#/results and https://www.votebuilder.com/. Note that these are only estimates and may fluctuate.
[3] As of 2019, there are approximately 87,191 voters in DPS District 1 with an active registration.
[4] Data source: Denver - 2019-06-13Report_ElectionTurnoutHistorical.xlsx
[5] Data source: https://www.zillow.com/washington-park-denver-co/home-values/
[6] Data source: https://www.zillow.com/belcaro-denver-co/home-values/
[7] Data source: https://www.denvergov.org/media/denverapps/electionresults/pdfs/20191105/Summary_Report_Denver_FinalUnofficialResults.pdf
[8] Data source: https://www.sciencedirect.com/science/article/abs/pii/S0092656605001017
[9] Data source: http://tracer.sos.colorado.gov/PublicSite/SearchPages/CandidateDetail.aspx?Type=CA&SeqID=44429
[10] Data source: https://cleanslatenowaction.org/dps-district-1-1
[11] Data source: http://tracer.sos.colorado.gov/PublicSite/SearchPages/CandidateDetail.aspx?Type=CA&SeqID=44167
[12] Total was compiled from all available weekly canvassing reports. In addition, volunteers canvassed without the use of VoteBuilder.
Featured image credit: https://cdn.5280.com/2019/11/Denver-Election_November-2019_Bouchard.jpeg
